A company produces five different products. The sales of these five products (in lakh number of packs) during 2005 and 2010 are shown in the following bar – graph.
Question is based on this graph. Sales (in lakh number of packs) of five different products of a company during 2005-2010. During the period 2005-2010, the minimum rate of increase in sales is in the case of :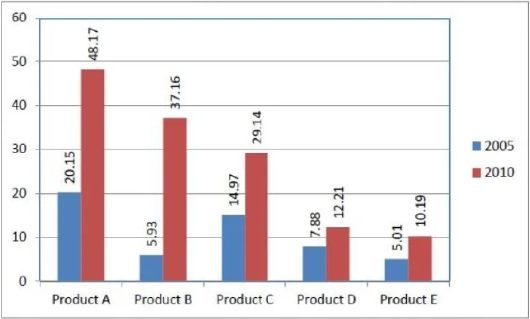
We calculate the percentage increase for each product using the formula: ((Sales 2010 - Sales 2005) / Sales 2005) * 100.
((48.17 - 20.15) / 20.15) * 100 ≈ 139.06%((37.16 - 5.93) / 5.93) * 100 ≈ 526.64%((29.14 - 14.97) / 14.97) * 100 ≈ 94.66%((12.21 - 7.88) / 7.88) * 100 ≈ 55.00%((10.19 - 5.01) / 5.01) * 100 ≈ 103.39%
Comparing the calculated percentages, the lowest value is approximately 55%, which corresponds to Product D.
Final Answer: The minimum rate of increase was for Product D.
Reinforce your conceptual grasp with related questions from NIMCET 2021:
Take timed full-length mock tests with authentic question distributions, negative marking (+12/-3 in Math), and instant All India Rank calculation.
Start Free Mock Test Series →